On This Page:
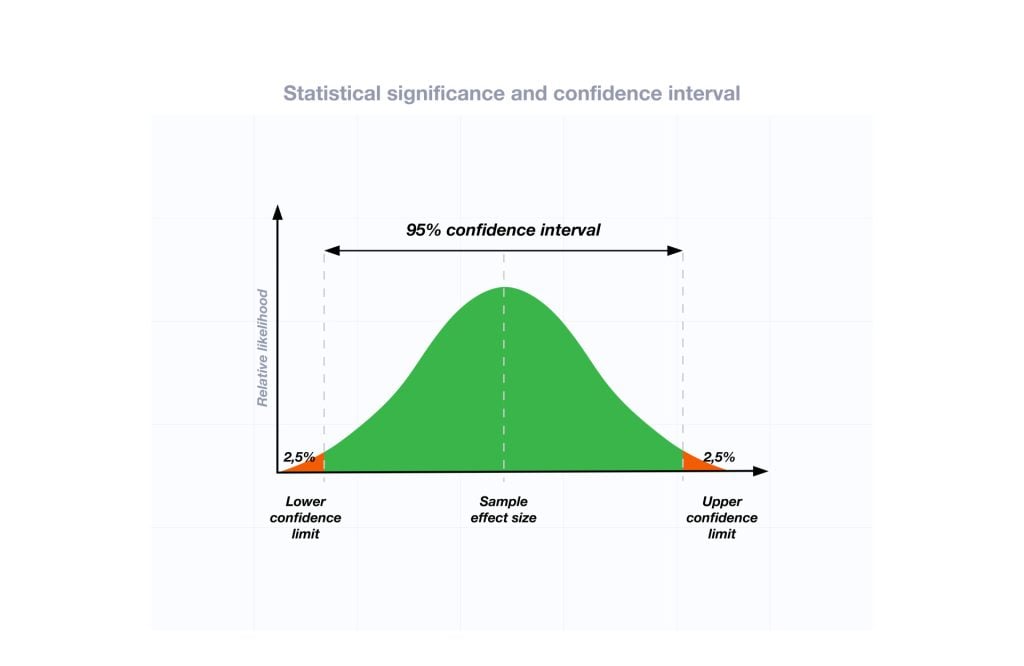
The confidence interval (CI) is a range of values that’s likely to include a population value with a certain degree of confidence. It is often expressed as a % whereby a population mean lies between an upper and lower interval.
What is a 95% confidence interval?
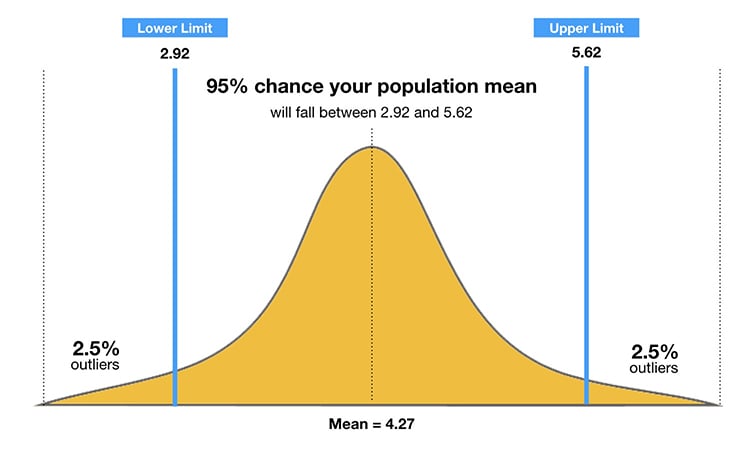
The 95% confidence interval is a range of values that you can be 95% confident contains the true mean of the population. Due to natural sampling variability, the sample mean (center of the CI) will vary from sample to sample.
The confidence is in the method, not in a particular CI. If we repeated the sampling method many times, approximately 95% of the intervals constructed would capture the true population mean.
Therefore, as the sample size increases, the range of interval values will narrow, meaning that you know that mean with much more accuracy than a smaller sample.
We can visualize this using a normal distribution (see the below graph).
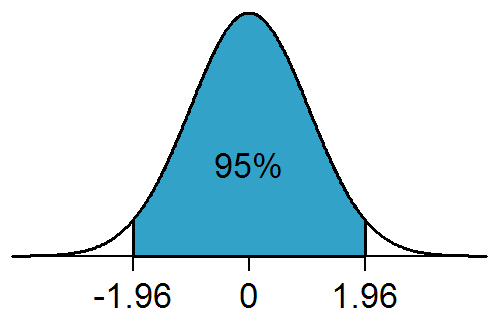
For example, the probability of the population mean value being between -1.96 and +1.96 standard deviations (z-scores) from the sample mean is 95%.
Accordingly, there is a 5% chance that the population mean lies outside of the upper and lower confidence interval (as illustrated by the 2.5% of outliers on either side of the 1.96 z-scores).
Why use confidence intervals?
It is more or less impossible to study every single person in a population, so researchers select a sample or sub-group of the population.
This means that the researcher can only estimate a population’s parameters (i.e., characteristics), the estimated range being calculated from a given set of sample data.
Therefore, a confidence interval is simply a way to measure how well your sample represents the population you are studying.
The probability that the confidence interval includes the true mean value within a population is called the confidence level of the CI.
You can calculate a CI for any confidence level you like, but the most commonly used value is 95%. A 95% confidence interval is a range of values (upper and lower) that you can be 95% certain contains the true mean of the population.
How to calculate
To calculate the confidence interval, start by computing the mean and standard error of the sample.
Remember, you must calculate an upper and low score for the confidence interval using the z-score for the chosen confidence level (see table below).
| Confidence Level | Z-Score |
|---|---|
| 0.90 | 1.645 |
| 0.95 | 1.96 |
| 0.99 | 2.58 |
Confidence interval formula
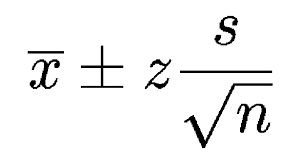
Where:
- X is the mean
- Z is the chosen Z-value (1.96 for 95%)
- s is the standard error
- n is the sample size
For the lower interval score, divide the standard error by the square root on n, and then multiply the sum of this calculation by the z-score (1.96 for 95%). Finally, subtract the value of this calculation from the sample mean.
An Example:
- X (mean) = 86
- Z = 1.960 (from the table above for 95%)
- s (standard error) = 6.2
- n (sample size) = 46
Lower Value: 86 – 1.960 × 6.2 √46 = 86 – 1.79 = 84.21
Upper Value: 86 + 1.960 × 6.2 √46 = 86 + 1.79 = 87.79
So the population mean is likely to be between 84.21 and 87.79
Population mean and sample mean
How can we be sure that the population mean is similar to the sample mean?
The narrower the interval (upper and lower values), the more precise our estimate is.
As a general rule, as the sample size increases, the confidence interval should become more narrow.
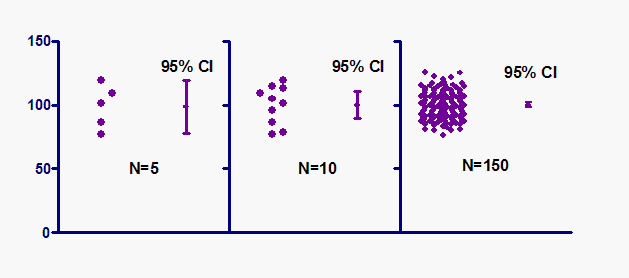
Therefore, with large samples, you can estimate the population mean more precisely than with smaller samples. Hence, the confidence interval is quite narrow when computed from a large sample.
How to report
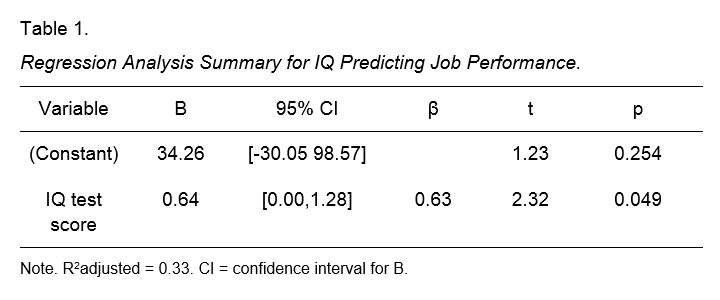
The APA 6 style manual states (p.117):
“ When reporting confidence intervals, use the format 95% CI [LL, UL] where LL is the lower limit of the confidence interval and UL is the upper limit.”
For example, one might report a 95% CI [5.62, 8.31].
Confidence intervals can also be reported in a table
What Does a Confidence Interval Reveal?
A confidence interval gives a range where we think a certain number (like an average) lies for the whole population, based on our sample data. The “confidence level” (like 95%) is how sure we are that this range includes the true value.
So, if we have a 95% confidence interval for the average height of all 16-year-olds as 5’4″ to 5’8″, we’re saying we’re 95% confident that the true average height for all 16-year-olds is somewhere between 5’4″ and 5’8″.
It doesn’t mean all heights are equally likely, just that the true average probably falls in this range. It’s a way to show our uncertainty in estimates.
Is The confidence interval the same as standard deviation?
No, they’re different. The standard deviation shows how much individual measurements in a group vary from the average. Think of it like how much students’ grades differ from the class average.
A confidence interval, on the other hand, is a range that we’re pretty sure (like 95% sure) contains the true average grade for all classes, based on our class. It’s about our certainty in estimating a true average, not about individual differences.
Does a boxplot show confidence intervals?
A standard box plot displays medians and interquartile ranges, not confidence intervals. However, some enhanced box plots can include confidence intervals around the median or mean, represented by notches or error bars.
While not a traditional feature, adding confidence intervals can give more insight into the data’s reliability of central tendency estimates.
Confidence Interval Practice Problems
- A researcher took a sample of 30 students’ test scores with an average score of 85 and a standard deviation of 5. What is the 95% confidence interval for the test scores?
- A study measures the heights of 50 people, finding an average height of 170 cm with a standard deviation of 10 cm. What is the 99% confidence interval for the population’s height?
- In a sample of 40 light bulbs, the mean lifetime is 5000 hours and the standard deviation is 400 hours. Compute a 90% confidence interval for the average lifetime of the bulbs.
Answers:
- For a 95% confidence interval and a sample size > 30, we typically use a z-score of 1.96. The formula for a confidence interval is (mean – (z* (std_dev/sqrt(n)), mean + (z* (std_dev/sqrt(n)). So, the confidence interval is (85 – (1.96*(5/sqrt(30))), 85 + (1.96*(5/sqrt(30))) = (83.21, 86.79).
- For a 99% confidence interval and a sample size > 30, we typically use a z-score of 2.58. So, the confidence interval is (170 – (2.58*(10/sqrt(50))), 170 + (2.58*(10/sqrt(50))) = (167.35, 172.65).
- For a 90% confidence interval and a sample size > 30, we typically use a z-score of 1.645. So, the confidence interval is (5000 – (1.645*(400/sqrt(40))), 5000 + (1.645*(400/sqrt(40))) = (4870.92, 5129.08).
